


Data source and study population
This study utilized the National Health Insurance Service National Sample Cohort (NHIS-NSC) as the primary data source to develop predictive models for CCVDs (NHIS-2022-2-318, IRB No. P01-202206-01-031). The NHIS covers over 97% of the population, and a random sample of 2% was extracted using the proportional allocation method, taking into account factors such as sex, age, enrollment type, insurance premium quantile, and region. Sampling was based on national health insurance enrollees in 2006, and data were collected from various databases, including eligibility factors (sex, age, insurance premium, etc.), health checkup information (body mass index [BMI], waist circumference, blood pressure, self-reported questionnaires, etc.), and hospital utilization data (hospital admissions, diagnoses, prescriptions, etc.) from 2002 to 2019. Additional details regarding the representativeness of the NHIS-NSC and supplementary information can be found in the available sources11 (Supplementary material).
Ascertainment of cardiovascular diseases
In this analysis, cerebrovascular disease (I60–I69) and ischemic heart disease (I20–I25) were used as dependent variables representing CCVDs. Subtypes of CCVDs were defined for additional analysis, including stroke (I60–I66, excluding I64), cerebral hemorrhage (I60–I62), and acute myocardial infarction (I21–I23). The baseline year was 2014, and a 5-year follow-up period was used to predict newly diagnosed CCVDs. To ensure the exclusion of patients with preexisting CCVD diagnoses, the washout period was defined as 2010–2014 (Fig. 1).

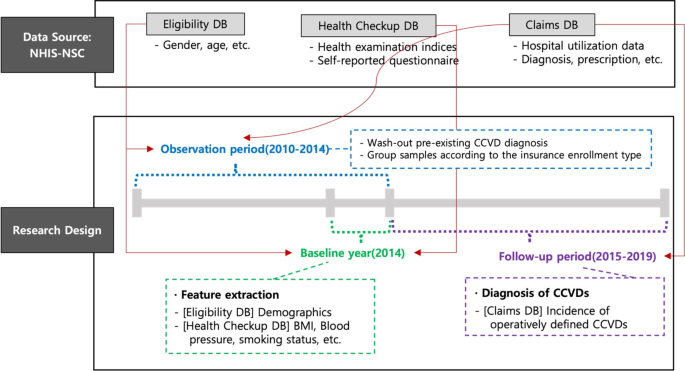
Data structure and research design.
Sample selection
The features used in the prediction models included health checkup variables that were conducted biennially. Initially, 418,208 participants with health checkup data available in either 2013 or 2014 and without a CCVD diagnosis between 2010 and 2014 were extracted. Participants with missing major examination variables or eligibility conditions were excluded, resulting in a total study population of 410,859 participants. Two groups were created to develop CCVD prediction models for individuals eligible for both private insurance types. Based on the conditions and operational definitions outlined in Tables 1, 126 and 413 samples met the criteria of the standardized insurance application form (henceforth, “standard group”) and 268,912 samples fulfilled the conditions of the simplified enrollment form (henceforth, “simplified group”) through restoration sampling. The “standard” group includes individuals who answered “No” to both Question A and Question B, while the “simplified” group includes those who answered “No” to both Question C and Question D. The standard questions are stricter regarding hospitalization, surgery, and prescriptions compared to the simplified questions. Therefore, the simplified group encompasses the standard group. The 15,534 individuals excluded from the sample are those who answered “Yes” to any of the simplified questions. A detailed discussion of screening for simplified and standard private insurance enrollees can be found in the literature12.
The items in this study were selected for two purposes: to mirror questionnaire responses typically provided by potential insurees to insurers before commencing insurance contracts and to be operationally defined within the dataset. Standard screening form questions typically mandate a longer period, often up to 5 years, during which individuals must have experienced no medical issues, including hospitalizations, surgeries, or diagnosed diseases. By contrast, simplified screening forms designed for individuals with substandard health conditions require shorter intervals without hospitalization or surgery. Disease diagnosis is limited to severe conditions, such as cancer.
Table 2 summarizes the descriptive statistics of the three samples; the incidence rate of the outcomes increased in the order of the standard group, the simplified enrollment group, and those without any screening process (referred to as the ‘all’ group). In particular, the standard group exhibited an incidence rate of approximately one-third of the overall incidence. The distribution of health checkup indicators and age followed a similar pattern. The standard group samples were characterized by younger age and exhibited lower levels of fasting blood serum triglycerides, systolic blood pressure (SBP), and various other health checkup indicators or family history records than the other groups.
Variables
Predictor variables were selected as follows: sex and age information were extracted from the eligibility database. Fifteen variables were obtained from the checkup database, including BMI, waist circumference, SBP, diastolic blood pressure, hemoglobin, fasting blood serum, total cholesterol, high-density lipoprotein cholesterol, low-density lipoprotein cholesterol, triglyceride, serum glutamic oxaloacetic transaminase, serum glutamic pyruvic transaminase, gamma-glutamyl transferase, urine dipstick test, serum creatinine, and estimated glomerular filtration rate.
Variables with specified thresholds were further processed to eliminate any variations in risk within the criteria defining the normal range for each index (Supplementary Table 1). Variables within the normal range were assigned a value of 0, whereas those beyond the normal range were adjusted to represent the absolute difference from the threshold value. This approach was adopted to estimate the incremental changes in risk beyond the normal range and capture the transition from no risk variation within the normal range to a potentially hazardous range. When the normal range provided was one-sided, a single variable indicating a deviation from the threshold value of the normal range was generated. For variables with a two-sided range, two variables representing the deviations from the minimum and maximum boundaries were generated. For example, if the normal range for BMI is 18.5–22.9, two variables—LOW_BMI and HIGH_BMI—were created to represent the distances from 18.5 to 22.9, respectively.
Statistical analysis
To predict the 5-year cumulative incidence of CCVDs, we utilized logistic regression and penalized logistic regression models, which offer the advantage of interpretability compared with black-box models. While complex models may improve predictive power, they often obscure the relationships between risk factors and outcomes. Logistic regression, widely used for binary outcomes, provides clear insights into variable importance, making it well-suited for clinical applications, without any severe loss of predictive ability.
To predict the 5-year cumulative incidence of CCVDs, we utilized logistic regression and penalized logistic regression models, which offer the advantage of interpretability compared with blackbox models. Logistic regression is widely used to predict binary outcomes using multiple variables. The logistic regression model is represented by the following equation:
$$\left_\right=\text\left\left(\frac\beta\:\right{1-_\right}\right)={X}_{i}\beta\:+{ \epsilon }_{i}$$
By examining the signs and magnitudes of the coefficient vector (\(\:\beta\:\)) in the model, the marginal effects of each risk factor can be calculated, enabling a straightforward interpretation of the impact that each predictor has on the likelihood of developing CCVDs. Penalized logistic regression further enhances the prediction performance by incorporating \(\:{l}_{1}\) or \(\:{l}_{2}\) penalty terms into the objective function, reducing the size of the coefficient vector, and addressing the issue of overfitting. A nonnegativity constraint was also imposed on the coefficient vector, except for sex, as the features were preprocessed to indicate the absolute distance from the normal range of each health checkup variable, as previously discussed. Therefore, the objective function is given by:
$$\:\widehat{\beta\:}=argmi{n}_{\beta\:}\left\{\frac{1}{2}\sum\:_{i}^{N}{\left({y}_{i}-{X}_{i}\beta\:\right)}^{2}+{\lambda\:}_{1}{\left|\left|\beta\:\right|\right|}_{1}+{\lambda\:}_{2}{\left|\left|\beta\:\right|\right|}_{2}\right\}\:s.t.\:\beta\:\ge\:0$$
In the LASSO model, the \(\:{l}_{1}\) penalty (\(\:{\lambda\:}_{1}\)) shrinks some coefficients to zero, allowing for the identification of the most influential predictors. This feature facilitates variable selection and the identification of key risk factors associated with CCVDs. Conversely, the ridge model, with its \(\:{l}_{2}\) penalty (\(\:{\lambda\:}_{2}\)), reduces the size of the coefficients without reducing them to zero. These regularization techniques help reduce data dependency and improve the generalizability of the model. Both models provide interpretable results while effectively addressing the issues of multicollinearity and overfitting13,14,15. For model training and validation, the study population was divided into an 80% training set and a 20% test set. The training set was further divided into 10 folds for hyperparameter tuning using 10-fold cross-validation (Fig. 2).

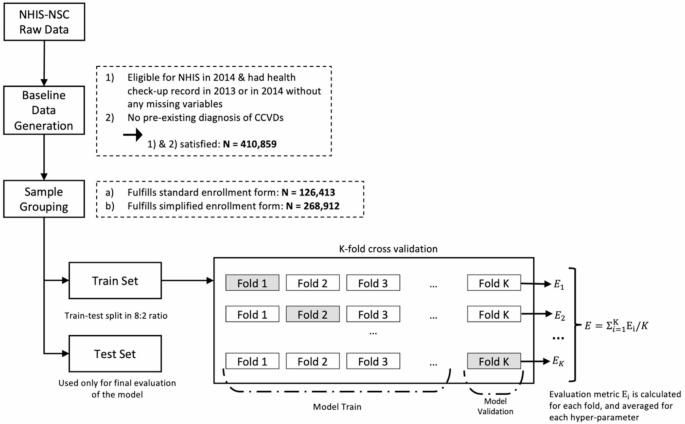
Sample selection, and data training process.
Evaluation metrics, such as the area under the receiver operating characteristic curve (AUROC), accuracy ([TN + TP]/[TN + FN + FP + TP]), recall (TP/[TP + FN]), and specificity (TN/[TN + FP]), were employed to compare the predictive powers between samples and models, where TN, TP, FN, and FP are the number of true negatives, true positives, false negatives, and false positives, respectively. Given the threshold dependency of these metrics and the imbalanced distribution of the outcome variables, a cutoff value was selected to optimize both recall and specificity. Specifically, the threshold was selected from the upper-left part of the receiver-operator curve, where the distance from the diagonal line was maximized16.
link