
Discovering patient groups in sequential electronic healthcare data using unsupervised representation learning | BMC Medical Informatics and Decision Making

To determine the practical applicability of NLP models in the context of real-life PICU EHR data, we applied the Doc2Vec family of semantic embedding algorithms to derive patient-specific feature vectors from processed EHR medical sequences and assessed the resulting feature vectors via unsupervised clustering techniques. We imposed no specific medical assumptions during data pre-processing and assessed the clustering outcomes categorically based on patients’ demographic and diagnostic profiles. In general, this research adhered to the standard pipeline of unsupervised learning applied to EHR data. The key stages are shown in Fig. 1.

The working pipeline of this study, a PICU EHR data was pulled from GOSH EHR repository and processed to a sequential format compatible with the embedding algorithm, b Embedding models were trained on the extracted PICU EHR sequences and were categorically evaluated, c Clustering of the obtained patient-specific embedding using distance-based metrics, d data-driven cluster interpretation with clinical domain knowledge
Data collection and pre-processing
This retrospective study was conducted in collaboration with University College London (UCL) and the Great Ormond Street Hospital for Children (GOSH) in London, United Kingdom. GOSH receives 242,694 outpatient visits and 42,112 inpatient visits yearly (as of 2021/2022) and is home to the largest critical paediatric care facility in the United Kingdom [20]. We exclusively used data from its general paediatric intensive care unit (PICU) for this work. All data used in this study was extracted from GOSH’s EHR database and was accessed via the GOSH’s secured digital research environment (DRE). The records were anonymised based on GOSH’s data-sharing protocol, where patients’ real names were replaced across all records with randomly generated identifiers. In addition, patients’ actual dates of birth were obscured and are only accurate to the exact month.
The PICU EHR data contained 980,182 total entries drawn from the medical histories of 1853 patients, each of whom has been admitted to the PICU at least once during the period spanning May 01, 2019, to January 08, 2023. A more detailed summary of the EHR data is provided in Summary of the EHR data section. The medical records incorporate data from multiple sources and can be primarily categorised into five categories: administrative, demographic, diagnostics, laboratory tests and therapeutic drug interventions. Administrative records provide information about patients’ interactions with GOSH, including hospitalisations and ward stays, which we used to identify PICU episodes. Demographic records provided information about patients’ profiles. We calculated the patients’ age at admission as their age at the beginning of PICU stay and used them as a metric to characterise the patient clusters from the clustering analysis. Due to data anonymisation, some very young patients’ ages at admissions are precise only to the level of months. For longitudinal patient records such as diagnostic codes, tests and intervention records, we limited our analysis to entries occurring exclusively within PICU admission episodes.
For training the document embedding Doc2Vec model, we constructed medical event sequences for each PICU episode using diagnosis, laboratory tests and medication records. PICU episodes without any medication or laboratory records were excluded or merged into other PICU episodes where appropriate, as shown in Summary of the EHR data section. We expected only categorical sequences for training Doc2Vec and aggregated all numerical lab test results to categorical features based on reference ranges. The PICU sequences are time-ordered, and duplicate events within an hour time-frame were removed.
Generating EHR medical sequences
In natural language processing applications, it is a common practice to treat each unique word from a given corpus as a ‘token’ and each sentence as a sequence of tokens. A similar approach to treat each patient’s journey as a sequence of medical events has been previously adopted by several EHR embedding models [21,22,23]. However, the temporal sequence of information and events within a patient’s journey holds significant implications on interpreting and presenting that journey and for the development of predictive and decision-support models.
In this study, we modified the data processing strategy from a Bidirectional Encoder Representation from Transformer (BERT) [24] extension model known as Med-BERT [23]. Instead of using observed ICD-10 codes, we focused exclusively on frequently-occurring laboratory and medication events and treated each unique laboratory and medication event as a medical event ‘token’. Each patient’s journey in the PICU was represented as a time-ordered sequence of medical tokens, which we then used to train the Doc2Vec embedding model. Each laboratory test component is combined with its associated categorical result (e.g., normal, high, and low) to form unique tokens for all possible combinations of test components and results. Concerning medications, only the names of the medications are preserved. An illustrative Doc2Vec training sequence is shown in Fig. 2. For duplicated tokens occuring within less than an hour, such as repeated medication or lab tests with the same outcomes, we retained only the first token to simplify the training sequences. Repeated tokens close to each other contribute minimal information when training word embedding networks and are often removed as ‘stop words’ in NLP.
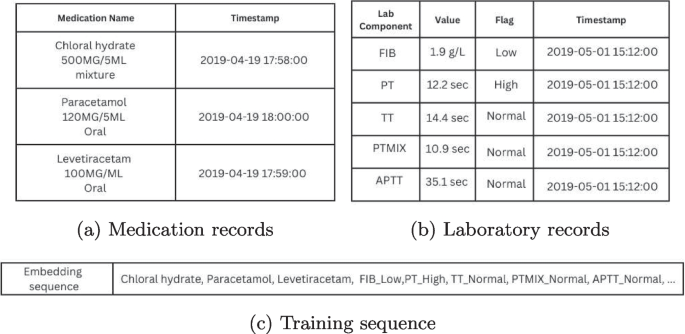
Example of a c Doc2Vec training sequence using a fragment of a patient’s PICU journey from 10/04/2019 to 16/06/2019, a medication records and b laboratory results are processed into c Doc2Vec training sequences. Medication names are often reported together with dosages, so regular expressions were used to isolate the names of medications
Rare tokens, defined as occurring in fewer than five patients’ journeys, were excluded from training. As explained in Appendix A, Doc2Vec assesses each token contextually with its surrounding tokens, making it less likely to learn useful embeddings for rare tokens due to a lack of contextual information. In practice, the original Word2Vec [25] implemented a frequency-based sampling routine to counter-balance frequent and rare tokens during training, but it is unclear how such a method can be translated to our study. We selected 5 as a minimum threshold to filter out a subset of very rare events that typically occurred only once or twice across the whole dataset. Since the number of tokens affects the number of learnable parameters, we removed tokens with very few occurrences to limit the size of our embedding models. We note that in embedding EHR data, the rate of occurrence is not equivalent to informativeness; intuitively, rare medical events often provide more information about a patient than common events. Limiting the training process to using only frequently-occurred tokens will reduce the precision of the resulting patient-specific embeddings. In total, out of the initial pool of 232 lab tokens and 761 medication tokens, 169 (73%) lab tokens and 478 (63%) medication tokens were retained for training the embedding algorithms.
Experiments and validations
We employed various regression and classification models alongside the main embedding/clustering models to assess the performance of our models and validate the choice of parameter values. The \(\mathcal {L}2\) regularised linear regression was used for numerical data, the logistic regression for binary classification, and the one-vs-one support vector classifier for multiclass classifications. The area under the curve (AUC) was calculated for the precision-recall curve due to low positive rates for binary predictors [26]. Unless stated otherwise, all learning-based validation studies were repeated 50 times with 80 – 20 train test splits, and the average accuracy on the test set was reported. For K-means clustering analysis, the distribution of categorical variables among clusters was tested via Pearson’s chi-squared test. Similarly, variations of numerical variables among clusters were tested via the Kruskal-Wallis test. To ensure we identify only significant characteristics among clusters from a diverse input, a p-value smaller than 0.0001 was considered to be significant.
Application of embedding algorithms
After pre-processing the EHR data, every PICU episode is represented by an ordered sequence of medical event tokens. While several EHR-specific feature learning/embedding algorithms exist[21,22,23], these algorithms are often designed with general visit-level data in mind and would translate poorly to longitudinal records generated within the PICU. Instead, we opted for Doc2Vec family of document embedding algorithms which offer a relatively versatile embedding network capable of processing sequential data, such as strings and sentences.
Doc2Vec [14] is a family of document embedding algorithms inspired by language neural networks and functions similarly to the word embedding algorithm Word2Vec [25]. Word2Vec was developed to extract token-specific features from a given corpus. Doc2Vec inherits the word embedding concept and extends it to construct document-specific features. Doc2Vec can learn sequence embedding in two different ways, namely, the distributed bags of words (D2V-dbow) model, and the distributed memory(D2V-dm) model. The D2V-dbow model forces the prediction network to predict tokens appearing in a sequence based on its vector embedding whilst the D2V-dm model predicts neighbouring tokens around a given token in a sequence. In our study, we treated each unique PICU sequence as a ‘sentence’ and used Doc2Vec to construct sequence-specific vectors. A detailed description of the Doc2Vec embedding algorithm is provided in Appendix A.
Overall, apart from the choice of learning methods, two additional Doc2Vec model parameters required tuning: the window size W and the embedding vector size N. The window size affects how token predictors are drawn during training, and the vector size determines the length of the embedded sequence vectors. Since the embedding size N affects the number of internal variables in the embedding model, we used the elbow method to determine the optimal choices of N to avoid overfitting. Experiments were repeated at different window sizes W to find an optimal combination between window size W and vector size N. The results of the evaluation studies are discussed in EHR data embedding and representation section.
Application of k-means clustering
One notable characteristic of word embedding algorithms is that the distance between learned word embeddings reflect semantic similarities [25]. Previous research in developing EHR embedding algorithms has used K-means clustering to quantitatively evaluate the quality of the obtained features [21]. In this study, we applied K-means clustering to obtain clusters of patients that exhibit closer proximity in the embedding space.
K-means clustering is a non-parametric clustering algorithm in which data points are divided into K clusters based on Euclidean distances. The number of clusters K is the primary modelling parameter. In this study, we determined the optimal value of K through stability analysis supplemented with the silhouette score. The clustering stability analysis is a series of bootstrap methods designed to test the reproducibility of the obtained clusters [27]. The silhouette coefficient[28] is a distance-based measurement of cluster separations, normalised between –1 and +1. A silhouette score close to +1 implies well-separated clusters, while a silhouette score close to –1 generally indicates erroneous cluster assignments.
Model evaluation
The Doc2Vec embedding models and the K-means clustering results were evaluated independently to avoid confirmation bias. We selected the optimal D2V model based on the quality of obtained token/sequence embeddings and used the elbow method to determine the optimal model. The resulting patient-specific features from the selected D2V model were used during K-means clustering.
The goal of evaluating Doc2Vec embedding models was to identify an optimal combination of model variation (D2V-dbow and D2V-dm), window size W and embedding size N. The Doc2Vec model performance was evaluated based on the conformity of the obtained token features and the mortality prediction accuracy of the patient-specific features. We employed the conformity analysis from Med2Vec [21] and used unsupervised clustering on the obtained laboratory test token features to ‘recover’ the components of the laboratory tests. We used the adjusted mutual information score between the lab token clusters and their original component labels to measure the conformity of the learned token features. High conformity was preferred as it implies that laboratory tests of different components are distinguishable in the embedding space. For predicting mortality, we used patient-specific features as input and took the average AUC to measure the ‘informativeness’ of the patient features.
Patient-specific features extracted by the optimal Doc2Vec model were used as features for the K-means embedding algorithm. The optimal number of clusters was determined via stability analysis and silhouette score. To investigate the homogeneity of patients in clusters, we compared the distribution of demographics, diagnoses and surgeries among the clusters. In particular, we were interested in the distributions of specific diagnoses between patient clusters. We isolated the diagnostic records for all patients and performed Pearson’s chi-square for all unique ICD-10 diagnoses. Diagnoses with skewed distributions among clusters (p<0.0001) were subjected to an additional two-tailed Spearman’s correlation test to identify diagnoses strongly correlated to a specific cluster.
link
![Average Cost of Medical School [2025]: Yearly + Total Costs](https://educationdata.org/wp-content/uploads/2025/09/page-1.png "Average Cost of Medical School [2025]: Yearly + Total Costs")


