FedWeight: mitigating covariate shift of federated learning on electronic health records data through patients re-weighting
Identifying covariate shifts in clinical data
ML-based data harmonization
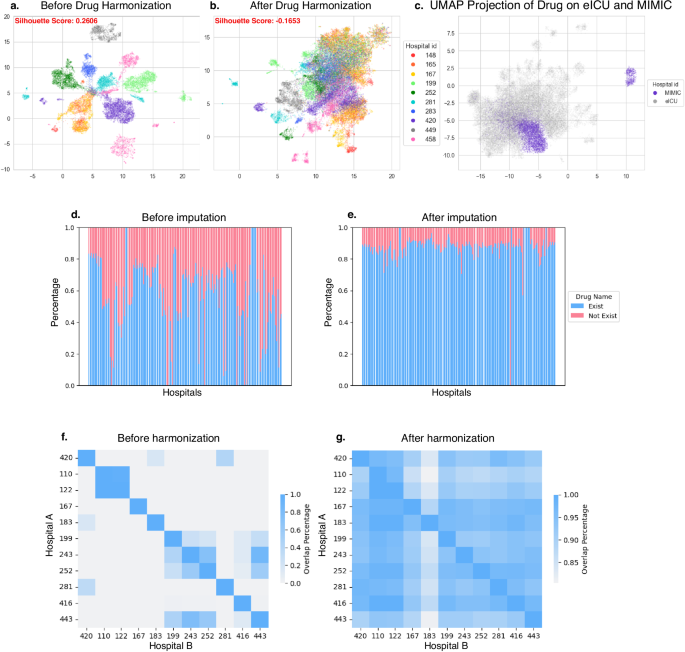
Different hospitals may adopt distinct administration practices, leading to variations in naming the same drug across clinical sites. Specifically, in the eICU dataset, different hospitals may use distinct encoding of drug administration. Some may use the generic name (e.g. “acetylsalicylic acid”), while others use the trade name (e.g. “aspirin”), although both refer to the same drug. Moreover, the dosage information is included in some drug names (e.g. “aspirin 10 mg”) but not all. As a result, we observed distinct clusters of patients by hospitals (Fig. 1a). Furthermore, over 40% of drug names are not recorded (Fig. 1d), although some of them have Hierarchical Ingredient Code List (HICL) codes. However, the HICL codes are not widely used in other hospitals, such as the one in MIMIC-III, which impedes the training of FL models across hospitals and datasets. In addition, there is almost no overlap in drug encodings across hospitals (Fig. 1f). To address this, we developed a method to impute missing drug names. We also developed a drug harmonization framework to combine drugs with similar identities and exclude dosage information (see “Data preprocessing” in “Methods”). This preprocessing step successfully decreased the unrecorded drug proportions to approximately 20% (Fig. 1e) and increased the number of common drugs to over 90%. The clustering of patients from different hospitals shows better mixing, although some hospitals still exhibit distinct clusters (Fig. 1b). To prepare for model training across datasets, we also harmonized data between two data domains namely eICU and MIMIC-III (Fig. 1c). Interestingly, we observed two distinct clusters from the MIMIC-III drug data (Supplementary Fig. 1a). Enrichment analysis revealed that one cluster is significantly associated with planned hospital admissions (elective ICU admission) and cardiovascular surgery patients (Supplementary Fig. 1b, c). These covariate shifts due to the heterogeneous distributions between hospitals and between datasets motivate us to develop FedWeight as experimented next.

a, b UMAP projection of drug data across hospitals on eICU before and after drug harmonization. The UMAP-reduced drug data is visualized in a scatter plot, with each data point colored by its respective hospital. The Silhouette Score96 measures the degree of mixing, where a lower score indicates better mixing of drug data across hospitals. c UMAP projection of harmonized medication data from eICU and MIMIC-III. d, e The drug rates before and after imputation of the eICU data. Since some drugs may lack recorded names, drug rates indicate the proportion of administered drugs with recorded names over all unique drugs. f, g Percentage of overlapped drugs before and after harmonization across the eICU hospitals. The percentage was computed as the proportion of drugs with recorded names present in both Hospital A and B relative to all drugs in Hospital B.
Heterogeneous patient demographics across eICU hospitals
In addition to the drug data, we also observed demographic differences among the hospitals in the eICU dataset. Specifically, we analyzed the distribution of patients by age, sex, BMI, and ethnicity within each hospital (Fig. 2a–d). Although most patients were between 50 and 89 years old, Hospital 148 had a higher proportion of younger patients (< 30) (Fig. 2a). In addition, Hospital 458 had a higher proportion of ethnically African patients, whereas Hospitals 167 and 165 had more Native American patients (Fig. 2b). Despite the overall low proportion of underweight patients across all hospitals, Hospital 199 manifested a slightly lower proportion of underweight patients and a higher proportion of obese patients (Fig. 2c). Furthermore, while most hospitals had more male patients than female patients, Hospital 283 had an almost equal proportion of male and female patients (Fig. 2d). These discrepancies in the demographics of patients in hospitals can hinder the effective generalization of models in FL settings.
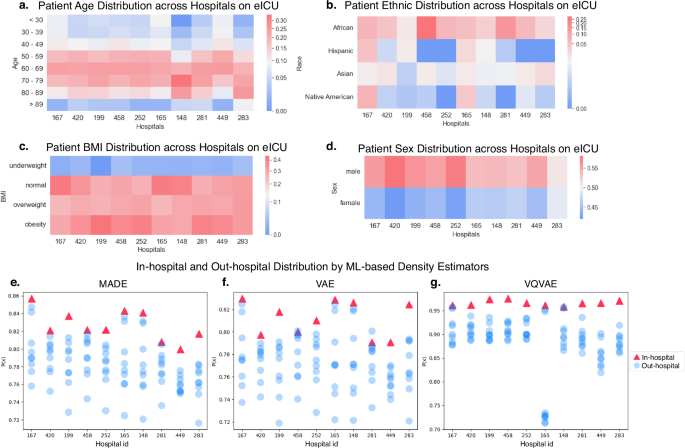
a–d Distribution differences in patient demographics, calculated as the proportion of patients in each demographic group within each hospital. Note: The Caucasian group was excluded from panel b to enhance the visibility of minority group distributions, as its majority presence would otherwise dominate the color scale and mask smaller variations. e–g In-hospital and out-hospital distribution by ML-based density estimators. For each hospital, the in-hospital estimate was calculated by applying its own density estimator to its patient data. The out-hospital estimate was computed by applying the same density estimator to patient data from a different hospital.
Quantifying data likelihood by ML-based density estimators
To address the problem of covariate shift, we first measured data distributions using model-based approach. To this end, we experimented with 3 deep learning density estimators, namely Masked Autoencoder for Density Estimation (MADE)39, Variational Autoencoder (VAE)40, and Vector Quantized Variational Autoencoder (VQ-VAE)41. Through each model, we can compare the data likelihoods between the training data from one hospital and test data from another hospital. In most hospitals, the in-hospital likelihood is significantly larger than the out-hospital likelihood (Fig. 2e–g), indicating that each hospital’s model aligns more closely with its own data than other hospitals’ data. The results also show that the 3 density estimators possess the sensitivity to detect covariate shifts.
Addressing covariate shifts by sample re-weighting
Putting the above together, we developed FedWeight, a novel model-agnostic ML method to re-weight the patients from source hospitals, aligning the trained models from each source with the data distribution observed in the target hospital (Fig. 3a–d). Specifically, the target hospital shares its density estimator with all source hospitals, which use it to calculate the reweighting ratio to train their local models. Intuitively, we assign larger weights to the patients from the source hospitals whose data distributions similar to the target population and smaller weights to those with dissimilar data distributions. Consequently, the trained model is better aligned with the target hospital data distribution, thereby effectively addressing the covariate shift problem in the FL settings. During training, only model parameters are shared between the target hospital and the source hospitals, thus effectively safeguarding patient privacy.
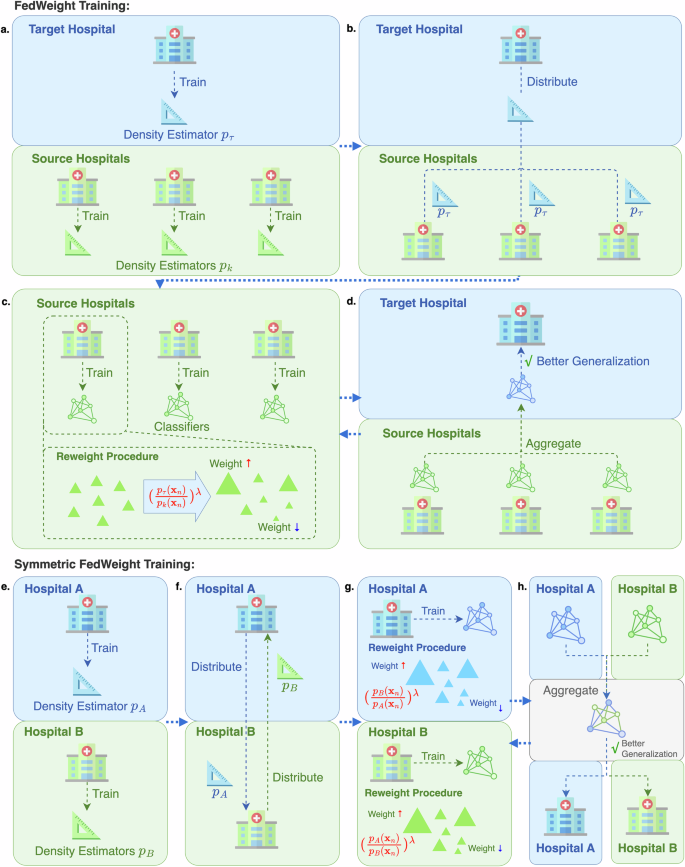
a The target and source hospitals independently train their density estimators. b The target hospital shares its density estimator with all source hospitals. c Each source hospital calculates a patient-specific re-weight, which is used to train its local model. d The target hospital aggregates the parameters from the source hospitals using the FL algorithm, which better generalizes the target hospital’s data. Symmetric FedWeight training process. e Hospital A and B independently train their density estimators. f Hospital A and B share their density estimators to each other. g Hospital A and B regard each other as targets, estimating the re-weight, which is used to train its local model. h Aggregate the local models from Hospital A and B using FL algorithm.
This method facilitates adapting source hospital data to the target. Additionally, we could also allow hospitals to mutually benefit from each other. To achieve this, we developed Symmetric FedWeight (Fig. 3e–h). For simplicity, we assumed a federated network with two hospitals, which can be easily extended to multiple hospitals. These hospitals will treat each other as the target and themselves as the source to calculate the reweighting ratio (Fig. 3g). The symmetric strategy enables both hospitals to adapt to each other’s data distributions.
Simulation study
To evaluate the effectiveness of our method, we first undertook simulation experiments on patients’ data. We trained the FedWeight model on the simulation dataset by employing density estimators, namely MADE, VAE, and VQ-VAE. Our simulation mimics the label imbalance in the real-world data (e.g., more disease cases than healthy controls). To prioritize precision over recall, we used the Area Under the Precision-Recall Curve (AUPRC) as the evaluation metric for model prediction. To assess the statistical significance of AUPRC values between FedWeight methods and the baseline FedAvg, we performed Wilcoxon rank-sum test (also known as the Mann-Whitney U test)42, a non-parametric test that is suitable for the limited number of AUPRC values in our federated model scenario43. We observed that all FedWeight models achieve an average AUPRC of 0.923, which significantly surpassed that of FedAvg, which had an average AUPRC of 0.917 (Wilcoxon rank-sum test p value < 0.05) (Supplementary Fig. 2a). This result demonstrates that our proposed model has enhanced predictive capability over this baseline with the datasets examined.
We also examined FedWeight’s capability in identifying influential features. Specifically, we evaluated the trained model by comparing its weights to a sparse reference model that simulates true influential features, using AUPRC as the evaluation metric. FedWeight models, when trained with density estimators such as VAE, VQ-VAE, and MADE, achieve comparable AUPRC results for detecting influential features (Supplementary Fig. 2b). All FedWeight models significantly outperform the baseline FedAvg, demonstrating their potentials to pinpoint important biomarkers for real-world applications (see “Detecting clinical features by FedWeight+SHAP analysis”).
Additionally, we computed the Pearson correlation between the weights of the reference model and the trained model. We observed that FedWeight exhibits a higher correlation with the reference model’s weights (Supplementary Fig. 2c). Therefore, FedWeight is more effective in capturing influential features, thus providing better model interpretability.
Predicting critical outcomes from eICU data
Accurately predicting critical clinical events can drastically improve patient outcomes, especially in the ICU. Inspired by prior studies5,6,44,45, we conducted experiments to predict four outcomes, namely mortality, ventilator use, sepsis, and ICU length of stay, using the first 48 hours of data from the eICU dataset (see “Data preprocessing” in “Methods”). These outcomes were selected based on their clinical importance, task diversity, and prevalence in existing FL research. Each plays a key role in ICU care: mortality prediction supports early risk stratification; ventilator use and sepsis prediction enable timely intervention and resource planning; and ICU length of stay aids in discharge management and capacity planning. Moreover, the four outcomes cover both classification (mortality, ventilator use, sepsis) and regression (length of stay) tasks, as well as both fixed-point (mortality, length of stay) and sequential (ventilator use, sepsis) prediction settings. This diversity enables a comprehensive evaluation of model performance across varying clinical and algorithmic scenarios.
To demonstrate the benefits of FL, we first compared the performance of non-FL (i.e., training on one hospital and tested on another) and FL methods. Our results show that all FL methods outperformed the non-FL method (Supplementary Table 1). Then, we compared the performance of FedWeight with both FedAvg and FedProx. Overall, FedWeight consistantly outperformed FedAvg across most hospitals and demonstrated competitive or superior performance compared to FedProx (Fig. 4a–d; Supplementary Table 2). Additionally, FedWeight variants also demonstrated performance close to that of the centralized model, which was trained on pooled of data from all hospitals using hospital IDs as one of the covariates to account for hospital-specific batch effects.

FedWeight methods were compared with FedAvg, FedProx, and a centralized model (i.e., model trained on the pooled eICU data and corrected by the covariate indicator variable for each hospital). a–d Performance of clinical outcome predictions on eICU, which was evaluated on a bootstrap-sampled dataset from five target hospitals (167, 199, 252, 420, and 458), with mean and standard deviation computed from the bootstrap samples. e Performance of cross-dataset federated model trained on eICU and evaluated on a bootstrapped test set of MIMIC-III. One-sided Wilcoxon test p values were calculated to compare FedWeight with FedAvg and FedProx. * and ** denote p values <0.05 and <0.01, respectively, for comparisons with FedAvg. * and ** indicate p values <0.05 and <0.01, respectively, for comparisons with FedProx.
For mortality prediction, Hospital 458 and 420 had the best results for all methods (Fig. 4a). FedWeight with the VQ-VAE density estimator provided superior results in all target hospitals (Wilcoxon test p value <0.05). Compared to FedProx, FedWeight performed better in Hospitals 167, 252 and 458, while FedProx had an advantage in Hospitals 199 and 420. Moreover, all FedWeight variants surpassed FedAvg in performance. They also show comparable performance to the centralized model.
For ventilator prediction, Hospital 167 and 458 demonstrate the highest AUPRC for all methods (Fig. 4b), as they had the most patients and fewer imbalanced labels. Moreover, FedWeight achieved higher AUPRC scores than FedAvg, notably in Hospitals 252, 420, and 458. It also outperformed FedProx, particularly in Hospitals 167, 199, 252, and 458. Furthermore, the overall performance was close to that of the centralized model. FedWeight with the VAE density estimator demonstrated the best performance in all target hospitals.
For sepsis prediction, Hospital 420, with fewer imbalanced labels, yielded the most favorable outcomes for all methods (Fig. 4c). Again, the FedWeight strategies also significantly outperformed both FedAvg and FedProx, with FedWeight using MADE and VAE providing the most accurate results in all target hospitals.
In the task of ICU length of stay prediction, most FedWeight variants yielded lower loss compared to FedAvg, demonstrated performance on par with FedProx, and closely matched the benchmark centralized model, especially in Hospital 199 (Fig. 4d).
In addition, we investigated the impact of different density estimators on the final performance of FedWeight. We first observed that the sample reweights generated by the three FedWeight density estimators (MAD, VAE and VQ-VAE) exhibited high similarity, as evidenced by strong correlations among the estimated reweights across all samples (Supplementary Fig. 3). Furthermore, the convergence quality of the density estimators had a noticeable effect on the performance of downstream FedWeight task models. In particular, both underfitting (due to insufficient training) and overfitting (due to excessive training) consistently led to performance degradation across various FedWeight tasks (Supplementary Fig. 4).
Together, these results demonstrate that FedWeight consistently improves upon FedAvg and offers competitive or superior performance to FedProx across diverse hospitals and prediction tasks, particularly in mortality and sepsis prediction. These findings highlight the robustness and adaptability of FedWeight for real-world clinical outcome prediction in federated settings.
Cross-dataset federated learning
In practice, each EHR dataset often requires separate access approval, making it difficult to share or centralize the data. In this scenario, models trained on each dataset can be pooled via the FL framework. To this end, we performed cross-dataset analysis by training our model on all hospitals from the eICU dataset and making predictions on MIMIC-III (Fig. 4e). As expected, the models trained on eICU hospitals demonstrate worse performance on MIMIC-III (Fig. 4e), compared to the performance on the held-out patients from eICU (Fig. 4a–d). Even so, FedWeight outperforms FedAvg, especially in ventilator use and ICU length of stay predictions, with all FedWeight variants significantly surpassing FedAvg (Wilcoxon test p value <0.01) and achieving results comparable to the centralized model (i.e., model trained on the pooled eICU data and corrected by the covariate indicator variable for each hospital). Compared to FedProx, while FedWeight exhibited slightly lower average scores in mortality, sepsis, and ICU length of stay predictions, it delivered more stable performance with reduced variance. For mortality prediction, FedWeight employing MADE and VAE as density estimators achieve significantly higher AUPRC than FedAvg (Wilcoxon rank-sum test p value <0.05) (Fig. 4e). In the case of sepsis prediction, FedWeight models with VAE and VQ-VAE demonstrate significantly superior performance compared to FedAvg (Wilcoxon rank-sum test p value <0.05). In addition, all FedWeight variants show statistical significance in ventilator and ICU length of stay prediction (Wilcoxon rank-sum test p value <0.01), compared to FedAvg. These findings suggest that FedWeight delivers more robust and adaptable performance, particularly in the presence of cross-dataset distribution shifts. This enhanced stability positions FedWeight as a more reliable solution for real-world federated clinical applications, where data distributions commonly vary across institutions.
Detecting clinical features by FedWeight+SHAP analysis
We sought to assess whether FedWeight improves detecting relevant features for the clinical outcome predictions using Shapley Additive Explanations (SHAP)46. As a reference, we computed the SHAP values of the centralized model. We used the Pearson correlation of the SHAP values between the federated model and the centralized models as the evaluation metric. We first performed the experiments using hospitals within the eICU dataset. FedWeight demonstrated a superior correlation of SHAP values compared to FedAvg across almost all hospitals, especially in predicting ventilator use. Specifically, for mortality prediction, all the FedWeight methods significantly outperform the baseline method (Wilcoxon test p value <0.01), except for Hospital 458 (Fig. 5a). Moreover, the FedWeight model using MADE and VAE density estimator demonstrated significantly higher correlation of SHAP values in all hospitals (Wilcoxon test p value <0.01). For ventilator prediction, FedWeight using VAE and VQ-VAE density estimator significantly outperformed FedAvg in all target hospitals (Wilcoxon test p value <0.01) (Fig. 5b). Regarding sepsis prediction, FedWeightVAE demonstrated the most significant results in all target hospitals (Wilcoxon test p value <0.05) (Fig. 5c). For the length of stay prediction, FedWeightMADE demonstrated significantly stronger correlations with the benchmark across all target hospitals, whilst FedWeightVAE showed significantly higher correlations in Hospital 167, 252, 420, 458 (Wilcoxon test p value <0.01) (Fig. 4d). To conclude, our experiments on the eICU dataset demonstrated that FedWeight SHAP values are more consistent with the benchmark SHAP values. As SHAP values quantify feature importance, this suggests that FedWeight is more effective in capturing influential features.
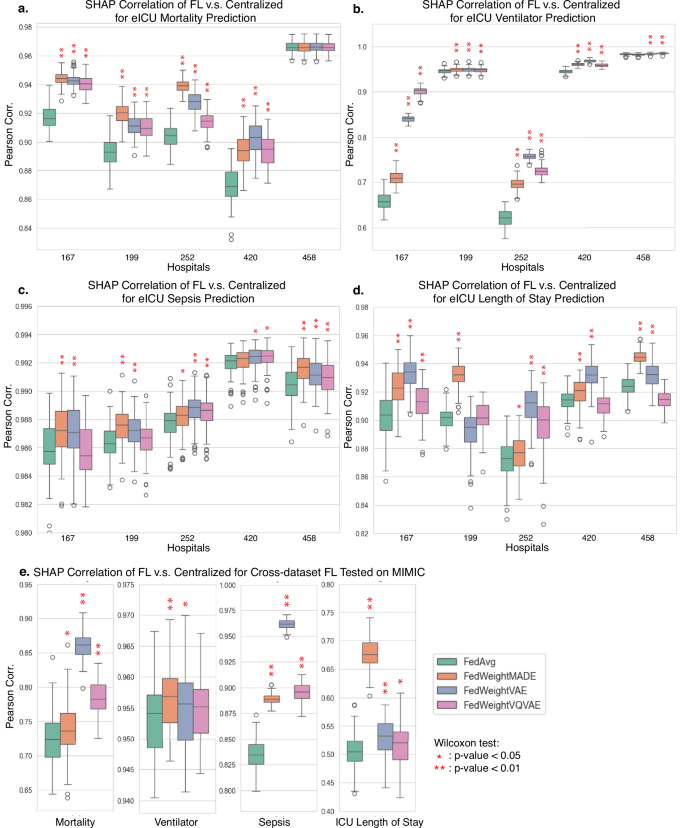
SHAP values were leveraged to identify feature importance, calculated from test data fed into the trained model. For mortality and ICU length of stay prediction, SHAP values were summed across all samples. For ventilator and sepsis prediction, SHAP values were aggregated across all time windows and samples, resulting in a one-dimensional vector of feature importance. We then calculated the Pearson correlation of feature importance between the federated and centralized model. a–d Pearson correlation of SHAP-based feature importance for clinical outcome predictions in eICU. The models were validated on the bootstrapped test sets of five target hospitals (167, 199, 252, 420, 458). e Pearson correlation of SHAP-based feature importance for cross-dataset federated learning, where models were trained on eICU, and the correlation was computed on the bootstrapped test set of MIMIC-III. One-sided Wilcoxon test p values were calculated against the baseline. * denotes the p values <0.05, and ** represents the p values <0.01.
We further performed a cross-dataset analysis, using eICU hospitals as the source and MIMIC-III as the target. FedWeight demonstrated significantly higher correlations in predicting mortality, sepsis, and ICU length of stay (Wilcoxon test p value <0.01) (Fig. 5e). Notably, FedWeight utilizing the VAE as the density estimator exhibited the best performance in mortality and sepsis prediction, underscoring its capacity to capture features highly associated with a patients’ length of stay in the ICU.
Top drugs and lab tests attributed to the clinical outcomes
Given the strong quantitative results for the feature attributions, we turn to individual drugs and lab tests that exhibit high SHAP values based on the best FedWeight model, namely FedWeightVAE.
Mortality
We leveraged drug administration and lab tests from the initial 48 h of ICU admission to predict patient mortality beyond this period. The drugs of the highest correlation with patient mortality are predominantly vasopressors or anesthetics (Fig. 6a). Specifically, glycopyrrolate is the foremost drug in mortality prediction, which reflects its role as an anticholinergic agent to manage respiratory secretions and mitigate vagal reflexes in critically ill patients during surgery47. Its association with mortality may serve as a proxy marker for high-acuity clinical scenarios, highlighting its relevance as a potential marker of severe physiological compromise in ICU settings. Following glycopyrrolate, vasopressors like vasopressin epinephrine, and phenylephrine emerge as critical prior to patients mortality, highlighting their role as primary stress hormones typically administered in the context of life-threatening conditions such as septic shock, cardiogenic shock, or profound hypotension48,49,50,51. Therefore, this correlation suggests that the necessity for vasopressor support often signals an advanced stage of critical illness, marked by high acuity and poor prognostic outcomes. After vasopressors, we also observed the administration of morphine prior to patient mortality in the ICU, which is likely attributable to its role in palliative care and the management of refractory pain and dyspnea in critically ill patients52.
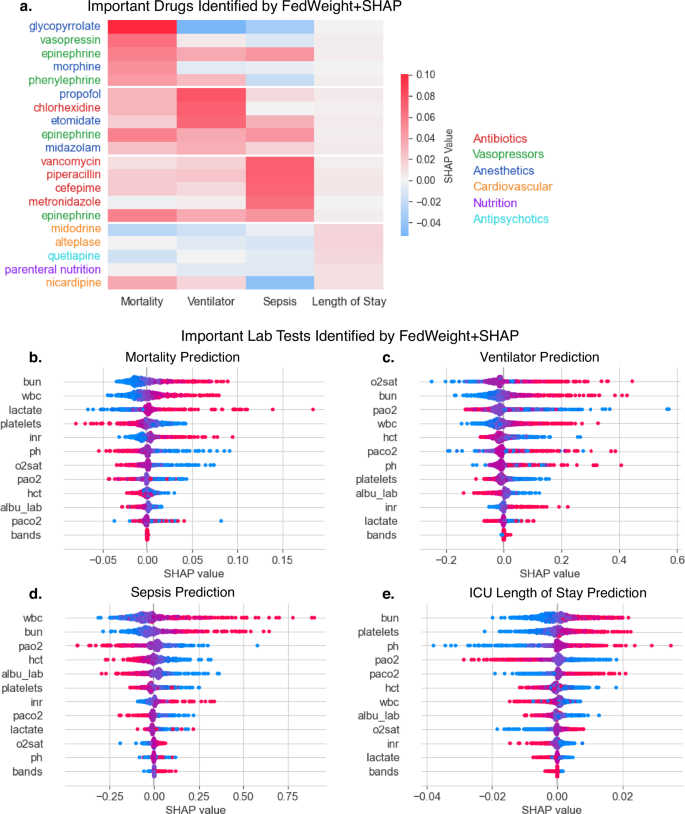
a SHAP values of the top 5 most important drugs identified by FedWeight for each clinical outcome. We computed SHAP values for each drugs present on target hospital. For mortality and ICU length of stay prediction, SHAP values were summed across all patients, while for ventilator and sepsis prediction, they were summed across both time windows and samples, resulting in a one-dimensional feature importance vector. For each clinical outcome, the top 5 most important drugs were selected, visualized with color intensities indicating their feature importance. b–e SHAP values of the top 12 most important lab tests for each clinical outcome, identified by FedWeightVAE. Each dot represents a sample from the target hospital. Features are ordered by their mean absolute SHAP value.
We identified a significant correlation between elevated blood urea nitrogen (BUN) levels and subsequent patient mortality, highlighting its utility as a pivotal biomarker for mortality risk in critical care (Fig. 6b). Elevated BUN reflects underlying pathophysiological processes, including renal insufficiency, systemic hypoperfusion, and heightened protein catabolism, which are key indicators of severe illness53,54,55,56,57. Therefore, this association underscores the prognostic significance of BUN in stratifying patient risk and guiding therapeutic interventions. Additionally, increased lactate levels are another profound indicators of mortality. This verifies the existing medical knowledge, as elevated lactate is a key clinical criterion for tissue hypoxia in critically ill patients, which is strongly associated with ICU mortality58,59,60,61.
Ventilator use
Since most patients initiate ventilation within 72 h of ICU admission, we established a 72-hour observation window, further segmented into six 12-h intervals. We aim to utilise drug administration and lab test results from each interval to predict ventilator use in the next. Additionally, we observed that 65.5% of patients in the eICU dataset experience multiple episodes of mechanical ventilation during their ICU stay. As a result, ventilator treatment may appear in multiple intervals for a single patient. Among all the drugs, propofol stands out for ventilator prediction, which is commonly administered in critical care to facilitate patient-ventilator synchrony, minimize agitation, and ensure tolerance of invasive respiratory support62,63. However, since propofol is commonly administered during intubation, its association with subsequent ventilator use likely stems from multiple ventilation episodes throughout the ICU stay. Following propofol, our model identified chlorhexidine as a drug administered to ICU patients who subsequently require mechanical ventilation, which facilitates the identification of patients at high risk for ventilation, while enabling medical practitioners to proactively prepare for ventilatory support. This identification verifies the established clinical knowledge. As a broad-spectrum antiseptic with bactericidal properties, chlorhexidine is widely utilized in oral care protocols within the ICU to mitigate the microbial colonization of the oropharynx and trachea, which are primary precursors to ventilator-associated pneumonia (VAP)64,65,66. Our model also identified that etomidate is the third most commonly administered drug prior to ventilator use. Specifically, etomidate is a rapid-onset, short-acting intravenous anesthetic commonly employed before endotracheal intubation. Although its administration might be associated with adrenal suppression, etomidate is particularly suitable for hemodynamically unstable patients due to its minimal impact on blood pressure67,68.
For ventilator prediction, elevated arterial blood gas (ABG) parameters, including oxygen saturation (O2sat), demonstrate a strong correlation with the subsequent initiation of ventilatory support (Fig. 6c). While this may appear counterintuitive, as oxygen saturation measurements are recorded before the initiation of ventilation, one would anticipate these parameters to be elevated only after ventilator treatment begins. Multiple episodes of mechanical ventilation could explain this phenomenon. This pattern could also arise from the initial use of high-flow oxygen or non-invasive ventilation (e.g., CPAP or BiPAP) as a preparatory measure before transitioning to invasive mechanical ventilation. Therefore, it is conceivable that patients undergo an initial period of ventilatory support, exhibit elevated oxygen saturation values, and subsequently require re-initiation of mechanical ventilation. Moreover, we also observed the elevated blood urea nitrogen (BUN) levels are highly correlated with the subsequent ventilatory support. Such elevations often stem from renal insufficiency, hypovolemia, or heightened protein catabolism associated with conditions like sepsis or multiorgan dysfunction. These pathophysiological states frequently precede respiratory failure, necessitating the commencement of mechanical ventilation. Therefore, markedly elevated BUN levels may serve as an ICU risk marker which often guides decisions on fluid management, dialysis, and ventilation timing.
Sepsis
Similar to ventilation use, we designed a 72-hour observation window comprising six 12-hour intervals. We aim to employ drug administration and lab tests from each interval to predict sepsis diagnosis in the subsequent interval. Confirming the existing medical knowledge and literature, antibiotics such as vancomycin, exhibit the highest overall feature attribution69,70, followed by piperacillin71, cefepime72, and metronidazole73. Notably, our model make prediction based on drugs administered prior to the sepsis diagnosis. Given that approximately 90% of sepsis cases are community-onset74, with most patients presenting infection symptoms prior to sepsis diagnosis, it is routine for patients to receive these antibiotics before a formal diagnosis of sepsis.
For sepsis prediction, the white blood cell (WBC) count holds the highest SHAP value (Fig. 6d), underscoring its strong association with septicemia and septic shock. Leukocytosis generally reflects the immune system’s activation in response to bacterial infection, driven by pro-inflammatory cytokines75. Therefore, clinicians may leverage WBC with other laboratory markers, including creatinine, platelet count, and lactate, for early diagnosis and monitoring of the condition.
ICU length of stay
Using drug administration and lab tests from the first 48 hours of ICU admission, we aim to predict the remaining ICU stay duration. Patients receiving cardiovascular drugs, including midodrine, alteplase, and nicardipine, tend to have prolonged ICU stays (Fig. 6a). This indicates that patients with cardiac surgery often require prolonged monitoring and extended care, as supported by existing research76.
We observed an elevated platelet count as a strong indicator of prolonged ICU length of stay (Fig. 6e). Specifically, thrombocytosis serves as a surrogate marker of heightened inflammatory activity and immune system activation. This hyperactive platelet response may signify the severity of the underlying pathology, such as infection, malignancy, or surgical recovery, all of which demand intensive and sustained care. Additionally, elevated platelet levels are indicative of a hypercoagulable state, predisposing patients to thrombotic complications, such as deep vein thrombosis or pulmonary embolism, which necessitates prolonged ICU stay for vigilant monitoring and therapeutic intervention77. Therefore, the association of thrombocytosis with prolonged ICU duration underscores its role as a biomarker of systemic stress and disease severity, providing insights into patient prognosis and resource allocation in the ICU.
Together, our combined FedWeight+SHAP analysis detected known drugs and lab tests associated with the clinical outcome predictions. This identification of influential variables warrants future investigation to explore causal mechanisms for the nuanced clinical associations identified in this analysis.
Mortality-associated latent topics captured by FedWeight-ETM
In the aforementioned experiments, FedWeight demonstrated exceptional performance in supervised prediction tasks. To identify sets of correlated clinical features in an unsupervised setting, topic models78,79 are natural choices as they can capture underlying patterns in high-dimensional EHR data80,81. To achieve this, we incorporated FedWeight into Embedded Topic Model (ETM)79 (see “Federated embedded topic model” in “Methods”), leveraging its ability to learn a low-dimensional semantic representation of clinical features while preserving patient privacy in a FL setting. First, we developed FedAvg-ETM, which shares the encoder weights and clinical feature embeddings between silos (i.e., eICU and MIMIC-III) to infer robust latent topics from distributed EHR data (Fig. 7a). To address covariate shifts, we further extended FedAvg-ETM to FedWeight-ETM (Fig. 7b). Quantitatively, we benchmarked the performances of non-federated ETM, FedAvg-ETM, and FedWeight-ETM by predicting readmission mortality using the corresponding topic mixtures as inputs to a logistic regression classifier. Overall, FedAvg-ETM and FedWeight-ETM demonstrated comparable performance and outperformed the baseline non-federated ETM across different topic numbers (Supplementary Fig. 5).
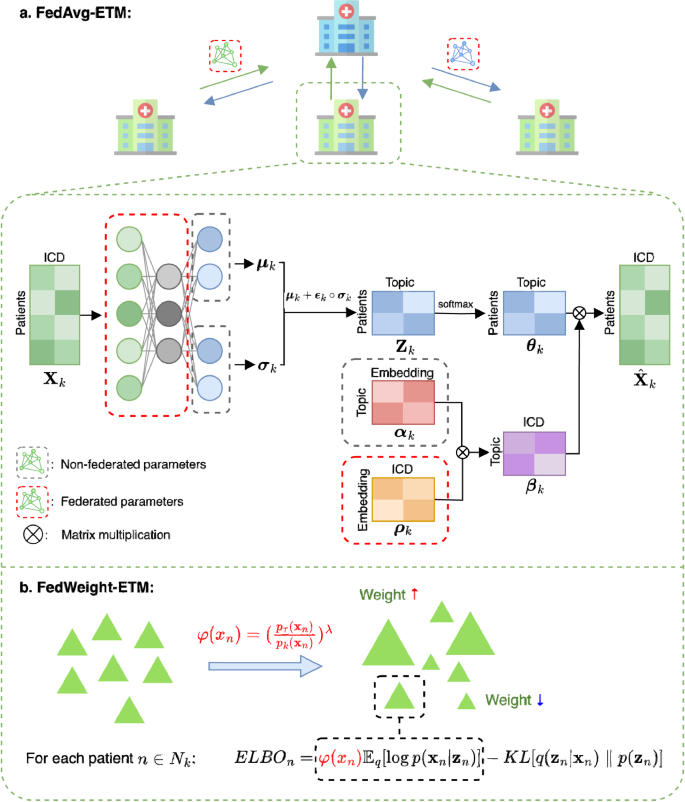
a FedAvg-ETM. In each local hospital k ∈ K, Xk is input into the encoder, whose output goes into two separate linear layers and produces μk and σk. Then, through the re-parameterization trick, we obtain the latent representation Zk. After applying the softmax function, Zk gives the patient-topic distribution θk. The learnable topic embedding αk and ICD embedding ρk generate the topic-ICD mixture βk. Then, βk is multiplied with θk to reconstruct the input. During federated averaging, only the encoder network and the ICD embedding are uploaded to the target hospital for aggregation, whilst all other model parameters are kept locally updated. b FedWeight-ETM. FedWeight-ETM builds on FedAvg-ETM by applying a re-weight to the log-likelihood term of the ELBO function for each patient.
We evaluated FedWeight-ETM’s ability to capture topics related to patient mortality. We identified the top 5 topics that are significantly associated with patient mortality. Figure 8a, b display the top three-digit International Classification of Diseases (9th revision)(ICD) diagnostic codes82 under each topic supported by the Fisher-exact test p values for eICU and MIMIC-III data, respectively. For eICU, Topic 16 is the most significant topic with the top ICD code being chronic renal failure (ICD-585). Indeed, renal failure disrupts fluid, electrolyte, and metabolic equilibrium and ultimately systemic homeostasis. For critically ill patients, it exacerbates comorbidities such as sepsis and is a hallmark of multiorgan dysfunction syndrome (MODS), perpetuating systemic inflammation and hemodynamic instability, which increases the risks of patient mortality83,84. As the second significant topic, Topic 31 involves cardiac dysrhythmias (ICD-427), which has direct impact on hemodynamic stability and causes critical conditions such as myocardial ischemia, heart failure, or sepsis. Moreover, ventricular arrhythmias and atrial fibrillation can lead to reduced cardiac output, tissue hypoperfusion, and multiorgan dysfunction in critically ill patients85. As the third focus, Topic 28 involves acute renal failure (ICD-584). We observed that while acute renal failure is strongly associated with mortality, its correlation is weaker than that of chronic renal failure. This may be due to its potential reversibility with timely medical intervention86.
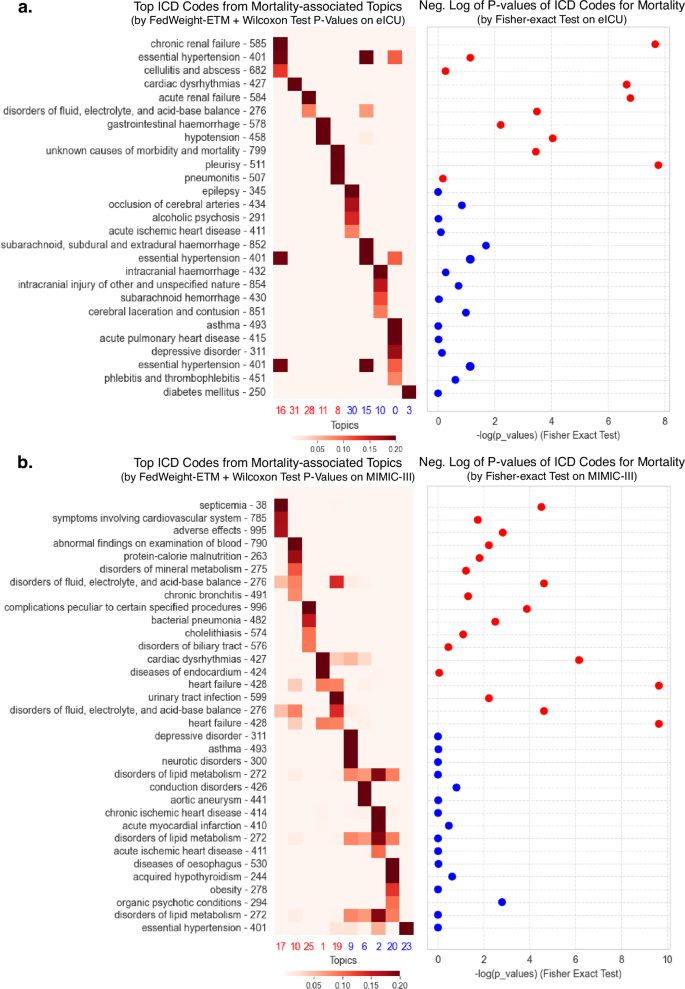
We identified the top 5 mortality-associated topics based on Wilcoxon test on topic proportions between deceased and surviving patients. The color intensity of the heatmap indicates the probability of an ICD codes within a given topic. We selected the top ICD codes whose probability is greater than 0.08. These ICD codes were validated by Fisher’s exact test p values on the eICU and MIMIC-III data, visualized in a scatter plot for the most and least mortality-associated ICD codes. a Mortality-associated topics and ICD codes on eICU. b Mortality-associated topics and ICD codes on MIMIC-III.
We also observed clinically meaningful topics inferred from the MIMIC-III dataset (Fig. 8b). Namely, Topic 17 is characterized by septicemia (ICD-38), which triggers widespread endothelial damage, capillary leakage, and coagulopathy, culminating in septic shock and multi-organ failure87. Furthermore, for Topic 10, the top disease identified by our model is abnormal findings on examination of blood (ICD-790). Severe abnormalities in blood parameters—such as metabolic acidosis, electrolyte imbalances, coagulation abnormalities, and hematologic dyscrasias—can precipitate multi-organ failure, hemodynamic instability, and increased susceptibility to infections88. These abnormalities often reflect underlying pathophysiological insults, such as sepsis, acute kidney injury, or hematological malignancies, which all increase the risks of patient mortality. As the third significant topic, Topic 25 is identified as complications peculiar to certain specified procedures (ICD-996). These complications involve device-related infections, graft failures, prosthetic malfunctions, and post-surgical hemorrhage, which can precipitate systemic instability, multi-organ failure, or sepsis. This indicates that FedWeight-ETM is able to efficaciously capture semantically meaningful topics, thus helping to uncovering clinically relevant patterns in healthcare data. The association of these medical conditions with mortality underscores the necessity of rigorous monitoring, prompt identification, and timely intervention to mitigate these risks and improve patient survival.
link


