
Predicting mortality risk in Alzheimer’s disease using machine learning based on lifestyle and physical activity

Participants
Figure 1 illustrates the selection process of participants for a study conducted on data collected from the National Health and Nutrition Examination Survey (NHANES)18 depression screening spanning from 2007 to 2020. NHANES is a program of studies designed to assess the health and nutritional status of adults and children in the United States, which collects data through interviews and physical examinations to provide insights into various health parameters across a diverse population sample. Initially, 102,956 individuals participated in the screening. The selection process involved several exclusion criteria: 22,636 individuals were excluded due to missing Patient Health Questionnaire-9 scores; 11,981 were excluded for not having AD or having incomplete data regarding the diagnosis of AD; and 15,108 were excluded because they lacked follow-up information. Following these exclusions, a final sample of 53,231 research participants was obtained. This sample was then randomly split into two datasets: a training set comprising 42,585 individuals (80%) and a test set consisting of 10,646 individuals (20%). The training set is used to develop the machine learning model, while the test set is used to evaluate its performance.
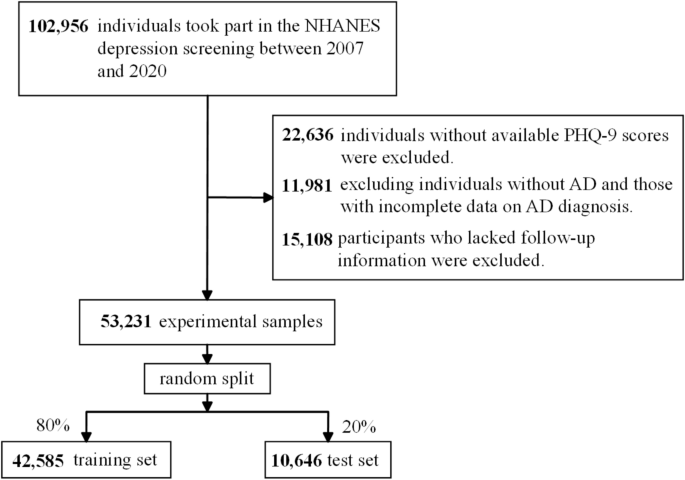
Flowchart of the study design and participants excluded from the study.
Categorization of participants via PHQ-9
Participants were assessed for depressive symptoms using the Patient Health Questionnaire-9 (PHQ-9), a validated self-report instrument designed to screen for depression severity19. Based on their PHQ-9 scores, participants were categorized into three groups: none (scores 0–4), mild (scores 5–9), and severe (scores 10–14)20. This categorization follows established guidelines to identify clinically relevant levels of depressive symptomatology, facilitating meaningful analysis and interpretation of depression’s impact across different severity levels in the studied population. Categorizing individuals with AD by depression severity is crucial, as depressive symptoms can significantly influence cognitive performance, disease progression trajectories, responsiveness to treatments, and overall quality of life among AD patients21. Clarifying the impact of varying depression severities on these outcomes may enhance targeted interventions and therapeutic strategies tailored specifically for individuals with AD.
Definition of AD mortality
AD mortality refers to death resulting from the complications associated with AD. The progression of AD is characterized by the gradual deterioration of cognitive functions, leading ultimately to death. Mortality in AD patients is often a result of complications such as infections, including pneumonia, or other co-morbid conditions like heart disease or stroke, which are exacerbated by the decline in health and function caused by AD22. Operationalizing the definition of AD mortality requires a robust set of criteria that takes into account not only the presence of AD as a primary or contributing cause of death but also accounts for the role of AD in the presence of other terminal conditions. This can involve analyzing death certificates, medical records, and family reports to establish AD as a cause of death. Furthermore, AD mortality is not uniformly classified across different regions and studies, which may lead to discrepancies in reporting and understanding the scale of AD mortality23,24.
In this study, we obtained data on AD mortality from the National Death Index (NDI) up to December 31, 201925, using the Tenth Revision of the International Classification of Diseases (ICD-10) to determine cause of death. In this analysis, AD mortality was identified by the ICD-10 codes G30.0, G30.1, G30.8, and G30.9. We follow the methodology outlined by the Centers for Disease Control and Prevention (CDC) for defining AD-related deaths, ensuring consistency with large-scale epidemiological studies and national statistics26.
Definition of covariates
The selection and definition of covariates for this study were critical in examining the multifaceted influences on Alzheimer’s disease mortality. Initial candidate covariates were derived from an extensive review of epidemiological studies addressing factors influencing mortality in Alzheimer’s patients, including lifestyle risk factors, metabolic and cardiovascular conditions, and sociodemographic variables7,8,9,10. Sociodemographic data, lifestyle factors, medical comorbidities, and therapeutic measures were exhaustively collected via standardized assessments, including questionnaires, diagnostic evaluations, and physical examinations. Participants’ smoking history was classified according to lifetime cigarette exposure. Individuals who reported smoking less than 100 cigarettes in their lifetime were labeled as ‘never smokers’. Those who had smoked over 100 cigarettes and were currently smoking at the time of the survey were categorized as ‘current smokers’. Similarly, ‘former smokers’ were individuals who had smoked more than 100 cigarettes in the past but had quit by the time of the study. Alcohol use was quantified based on frequency, with ‘drinkers’ defined as those who consumed alcohol on at least 12 days throughout the past year. Physical activity levels were measured using the Global Physical Activity Questionnaire, which takes into account exercise from leisure, work, and transport. Activities were distinguished by their intensity—either ‘vigorous’ or ‘moderate’. The Total Physical Activity (TPA) score was derived by combining the duration of moderate activities and the double duration of vigorous activities, considering individuals with more than 150 min of combined weekly activity as ‘active’. Diabetes status incorporated self-reports, clinical measurements such as fasting glucose and glycohemoglobin levels, and information on anti-diabetic medication or insulin use. The presence of cardiovascular diseases (CVD) was identified through medical diagnosis records, including conditions such as congestive heart failure, coronary artery disease, angina, myocardial infarction, or stroke. Pharmacological interventions were recorded, with a particular focus on medications that manage blood sugar, blood pressure, and cholesterol levels. These were identified through detailed questionnaires that delved into diabetes management and cardiovascular health. Body mass index (BMI) was calculated using height and weight (kg/m2), providing a standard metric for assessing body fat and categorizing weight status. Total cholesterol (TC) readings were taken under strict laboratory conditions, with detailed methodologies outlined in the NHANES Laboratory/Medical Technician Procedures Manual. This comprehensive collection of covariates enabled a nuanced analysis of factors that could influence mortality risk among individuals with Alzheimer’s disease, thereby supporting the development of more targeted interventions. In addition, all variable summaries are in Table S1.
Data preprocessing
In the preprocessing stage, missing data were addressed using the Random Forest imputation method, a commonly employed machine learning-based technique that effectively captures non-linear relationships among variables, thus providing robust estimates for missing values (Stekhoven & Bühlmann, 2012). For variable transformations, categorical survey responses, such as binary “yes/no” questions, were numerically encoded to facilitate quantitative analysis. Specifically, “yes” responses were converted to ‘1’, while “no” responses were converted to ‘0’, a standard approach to binary categorical variable transformation (Kuhn & Johnson, 2013).
Statistical analysis
Model development
We selected the Random Survival Forest model to capture potential nonlinear relationships and complex interactions among predictors, while the Cox proportional hazards model was chosen for its interpretability and widespread acceptance in time-to-event analysis. In the context of this study, meticulous data analysis was conducted using Python, widely regarded for its robust capabilities in statistical computation. The construction of our predictive models was fundamentally supported by the utilization of two prominent Python libraries: ‘sksurv’ and ‘lifelines’. ‘sksurv’ was instrumental for implementing RSF model, celebrated for its precision in analyzing survival data. RSF model is an advanced machine learning technique that extends the traditional random forest algorithm to analyze time-to-event data, providing robust and interpretable predictions for survival analysis by handling censored and uncensored data. We optimized the hyperparameters of the RSF using cross-validation, a widely adopted strategy to enhance model reproducibility27,28. Ultimately, we determined that setting the number of estimators to 100 (n_estimators = 100) and fixing the random seed for reproducibility (random_state = 24) provided the most robust results for our RSF model.
In tandem, ‘lifelines’ provided the infrastructure necessary for crafting the Cox proportional hazards model, a seminal tool in the field of survival estimations. A pivotal stage of our analysis involved deploying the ‘permutation_importance’ module from Python, an astute methodological selection for assessing the importance of variables. This indispensable process allowed for an in-depth investigation into the contributory weight of each variable, shedding light on the most significant predictors of survival rates. This facet of the study is crucial, as it amplifies our understanding of the factors that are most influential in determining the prognostic outcomes for patients with Alzheimer’s Disease.
Model validation
To assess the robustness and predictive performance of our model, we employed a hold-out validation strategy in which 30% of the dataset was randomly reserved for testing. This approach provided an objective and independent measure of model performance. The same datasets, with a consistent 70/30 split, were utilized to develop and validate both the RSF and the Cox proportional hazards models, ensuring comparability across methods. Our validation emphasized two key dimensions: discrimination and calibration. Discrimination, reflecting a model’s capacity to differentiate between outcomes, was evaluated using the iAUC and time-dependent AUC (tAUC). Calibration, indicating the alignment between predicted probabilities and actual outcomes, was assessed via the integrated Brier score (iBS) and prediction error (PE). These metrics offered critical insights into the model’s accuracy in representing patient outcomes. Additionally, patients were stratified into ‘high-risk’ and ‘low-risk’ groups based on median predictive scores, which further supported refined risk assessment and personalized decision-making.
In clinical research, several statistical metrics are pivotal for evaluating the performance of prognostic models, including the integrated area under the curve (iAUC), time-dependent AUC (tAUC), integrated Brier score (iBS), prediction error (PE), and concordance index (C-index). The iAUC and tAUC primarily assess a model’s discriminatory power, reflecting its ability to distinguish between patients who will experience an event and those who will not over a specified time horizon29. Higher iAUC and tAUC values indicate superior discrimination, facilitating the early identification of high-risk individuals. Calibration is gauged through the iBS and PE, which compare predicted probabilities against observed outcomes. Lower iBS and PE values signify tighter alignment between predictions and actual events, thereby enhancing the clinical utility of the model30. Additionally, the C-index evaluates the proportion of correctly ranked pairs in survival analysis and is widely regarded for handling censored data31. A higher C-index reflects better model discrimination, indicating that the model more accurately predicts the order of events. Collectively, these metrics offer a comprehensive view of model accuracy and reliability, aiding clinicians in risk stratification and informed decision-making for patient management.
Model output
The primary outcome of this study was AD-related mortality. The endpoint was operationally defined as death attributed either directly to Alzheimer’s disease or resulting from complications exacerbated by AD, such as infections (particularly pneumonia) or comorbid conditions including heart disease or stroke. Mortality data were obtained from the National Death Index (NDI) through December 31, 2019, and causes of death were identified using the International Classification of Diseases, Tenth Revision (ICD-10) codes: G30.0, G30.1, G30.8, and G30.9. This definition aligns with the Centers for Disease Control and Prevention’s standards for categorizing AD-related deaths, ensuring consistency with epidemiological research. Accurate classification of this endpoint was crucial for assessing the predictive performance of the developed machine learning survival models, which aimed at forecasting mortality risk based on lifestyle and physical activity metrics.
link


![Average Cost of Medical School [2025]: Yearly + Total Costs](https://educationdata.org/wp-content/uploads/2025/09/page-1.png "Average Cost of Medical School [2025]: Yearly + Total Costs")